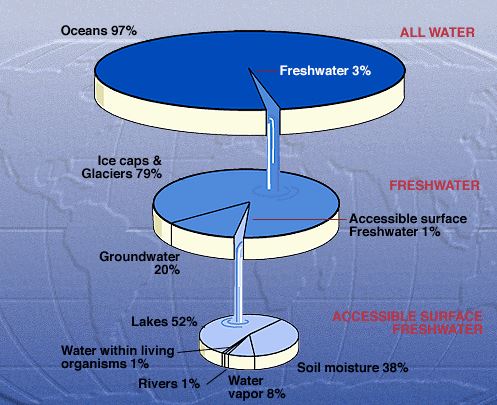
Total Water vs. Freshwater

If all of the Earth’s water from oceans, icecaps and glaciers, lakes, rivers, groundwater and the atmosphere were collected in one place, the total volume would equal approximately 332.5 million cubic miles (mi³), where one cubic mile equals more than 1.1 trillion gallons. Of that total volume, 97% is saline water in oceans, meaning only 3% (about 22,339 mi³) is freshwater. Of that freshwater portion, approximately 69% is frozen in glaciers and ice caps, 20% is groundwater and only 1% is accessible surface freshwater. Of that 1% of accessible surface freshwater, only about 53% is located in lakes and streams (Shiklomanov, 1993; U.S. Geological Survey [USGS], 2016). Therefore, water in freshwater lakes and streams is about 52% of the 1% accessible water, of the 3% of the total which is freshwater, or only 0.015% of the total water in the Earth!

Diagram showing the breakdown of where the Earth's water is found.
Distribution of the world's water. Houston Museum of Natural Science (n.d.).
Water SourceWater volume, cubic milesPercent of freshwaterPercent of total water
Oceans, Seas & Bays321,000,000--96.54%
Ice caps, Glaciers & Permanent Snow5,773,00068.7%1.74%
Groundwater
Fresh
Saline
5,614,000
2,526,000
3,088,000
--
30.1%
--
1.69%
0.76%
0.93%
Soil Moisture3,9590.05%0.001%
Ground Ice & Permafrost71,9700.86%0.022%
Lakes
Fresh
Saline
42,320
21,830
20,490
--
0.26%
--
0.013%
0.007%
0.006%
Atmosphere3,0950.04%0.001%
Swamp Water2,7520.03%0.0008%
Rivers5090.006%0.0002%
Biological Water2690.003%0.0001%
Table altered from Shiklomanov, 1993, in Gleick (ed.). Percentages may not sum to 100% due to rounding.

The Water Cycle

Earth, for the most part, is a “closed system,” meaning that as a whole, it neither gains nor loses much matter, including water. Consequently, the same 332.5 million cubic miles (mi³) of water on Earth today also existed millions of years ago (Ritschard, 1999; USGS, 2016). Driven by solar energy and gravitational forces, water is continually moving around, through and above the Earth as it changes its form into water vapor, liquid and ice (National Weather Service [NWS], 2010).

This continuous movement of water on, above and below the surface of the Earth is referred to as the water cycle, or hydrologic cycle. The figure below depicts the various processes involved in the water cycle. It is important to note that the water cycle has no starting point, but the discussion below begins with the oceans because that is where most of the Earth’s water exists. Furthermore, water molecules do not always move through the cycle in the order of the processes described below due to a number of factors, including geographic variability. For example, after an episode of precipitation, some of the water may evaporate back into the atmosphere right away, some may infiltrate into the ground as soil moisture, some may percolate deep into the groundwater tables, and some may run off into surface waters. Additionally, sometimes humans intercept the water at different stages of the cycle (Graham, Parkinson & Chahine, 2010; NWS, 2010).

Diagram of the phase changes of matter.
Phase Changes of Matter. Encyclopædia Britannica (2011).
Diagram of the water cycle.
Water Cycle Diagram. NOAA (2015).

Evaporation occurs as the sun heats the water bodies at the Earth’s surface, causing the water to change its state from liquid to gas (water vapor). Evaporation provides nearly 90% of the moisture in the atmosphere. On a global scale, the amount of water evaporating is approximately equal to the amount of water falling back to the Earth as precipitation; however, variation exists geographically. Over the continents, precipitation usually exceeds evaporation, and over the oceans, evaporation typically exceeds precipitation. The process of evaporation is the opposite of condensation.

Transpiration is the evaporation of (liquid) water from plants into the atmosphere. For most plants, transpiration is largely controlled by atmospheric humidity and soil moisture content, with nearly all (~99%) of all water entering the roots transpiring into the atmosphere. Nearly 10% of the moisture in the atmosphere is released by plants through transpiration.

Sublimation occurs when snow and ice change form into water vapor without first melting in a liquid state. While evaporation (nearly 90%) and transpiration (nearly 10%) account for almost all of the moisture in the atmosphere, sublimation and volcanic emissions also provide a very small portion of moisture for the atmosphere. The process of sublimation is the opposite of deposition.

Condensation occurs when water vapor in the atmosphere changes into a liquid state due to a difference between the temperature of the air and dew point. After water vapor enters the lower atmosphere from one of the above processes, rising air currents carry it upward where air is cooler, becoming more likely to condense to form cloud droplets. The process of condensation is the opposite of evaporation.

Transportation is referred to as the movement of water, in any of its three forms, through the atmosphere. For example, water vapor produced from evaporation over the oceans may be carried by the winds and fall back to the Earth over land via precipitation.

Precipitation occurs when clouds become saturated as the condensation particles becomes too large, through collision and coalesce, for the rising air to support, and thus fall to the Earth in the form of rain, hail, sleet or snow. As noted above, the amount of water evaporating is approximately equal to the amount of water falling back to the Earth via precipitation on a global scale; however, variation is created by geographic variables, resulting in precipitation typically exceeding evaporation over the continents, and evaporation exceeding precipitation over the oceans. Precipitation is the primary way freshwater is delivered to the Earth, with an average of 38.5 inches falling over both the oceans and land masses annually.

Deposition occurs when water vapor (gas) changes into ice (solid) without going through the liquid phase, such as when frost forms on the ground on clear, cold nights. The process of deposition is the opposite of sublimation.

Infiltration is the movement of water into the ground from the surface. While some water stays close to the surface, some is able to move past the soil and deep into the groundwater, which is referred to as percolation.

Surface flow is the river, lake and stream transport of water to the oceans. Some precipitation falls on saturated soil or is only able to infiltrate the Earth’s surface in the top, shallow soil layer, allowing the water to more easily reach and join surface waters flowing towards the oceans. One the other hand, some precipitation is able to permeate the Earth’s surface and percolate far enough down to reach aquifers. Therefore, groundwater flow is the flow of water underground in aquifers, which may return to the surface through openings in the land surface (springs) or eventually seep into the oceans.

Plant uptake occurs when water is taken from groundwater flow and soil moisture up into plants’ roots and tissues. For most plants, only about 1% of the water drawn up is used by the plant, while the remaining 99% is passed back into the atmosphere via transpiration.

Colorado & The Water Cycle

Throughout the arid West, humans greatly rely on snowpack for their water supply. In Colorado, approximately 80% of surface water supplies are the result of melting snowpack (Doesken, 2013). Wind carries moisture into Colorado from the gulfs of Mexico and California, Pacific Ocean, Mississippi Valley and localized sources. If the air masses contain enough water vapor, they will condense and create precipitation as they rise over the Rockies. During the winter and early spring, most precipitation occurs in the form of snow, which begins to buildup high in the mountains to create somewhat of a frozen reservoir. As temperatures increase moving into spring and summer, the snow begins to melt and travel down the mountains. Rainfall and snowmelt runoff into nearby surface waters, replenish shallow groundwater supplies, increase soil moisture and percolate into deep groundwater aquifers. A portion is also lost to evaporation. Coloradans use these surface and groundwater supplies, often multiple times, before they flow out of the state towards the oceans (Water Education Colorado [WEco], 2005).

Diagram of the water cycle incorporating mountains to show their important for Colorado.
The Water Cycle. NASA (2012).

Summary of the Water Cycle by the USGS Water Science School (2105)
This website contains a summary of the water cycle and its processes. Links on the page go to detailed webpages providing definitions, explanations and visualizations of each of the processes.

The Hydrologic Cycle: Water’s journey through time by Anne E. Egger, Visionlearning Vol. EAS-2(2), (2003)
This educational module discusses the hydrologic cycle, including the various water reservoirs in the oceans, in the air and on the land. The module addresses connections between the hydrologic cycle, climate and the impacts humans have had on the cycle.

The Water Cycle – What is it? by The Water Project
This website contains helpful information and links to experiments and resources about the water cycle for use in the classroom or at home.

Water Cycle by NOAA (2015)
This website provides a long list of water cycle resources, ranging from background information, to real world data to multimedia materials.

BBC. (2016). The water cycle and river terminology. Bitesize.

Doesken, N. (2013). Climate: The Most Important Natural Resource. In Citizen’s Guide to Colorado Climate Change (p. 4-13). Water Education Colorado [WEco].

Encyclopedia Britannica, Inc. (2011). Phase State of Matter [Figure].

Houston Museum of Natural History. (n.d.). Distribution of the World’s Water [Chart/Figure]. Earth Forum.

Graham, S., Parkinson, C., & Chahine, M. (2010). The Water Cycle. Greenbelt, MD: The Earth Observatory, NASA.

National Aeronautics and Space Administration [NASA]. (2012). The Water Cycle [Figure]. Global Precipitation Measurement.

National Oceanic and Atmospheric Administration [NOAA]. (2015). Water Cycle [Figure]. Water Education.

National Weather Service [NWS]. (2010). The Hydrologic Cycle. The Jetstream.

Ritschard, R. (1999). Global Water Cycle. Paper prepared for the Water in the Solar System – Educators’ Online Workshop, November 1st – 19th, 1999. Global Hydrology and Climate Center.

Shiklomanov, I. (1993). Chapter 2: World fresh water resources. In P.H. Gleick (ed.), Water in Crisis: A Guide to the World’s Fresh Water Resources (pp. 13-24). New York, NY: Oxford University Press.

U.S. Geological Survey [USGS]. (2016). How much water is there on, in, and above the Earth? USGS Water Science School.

Water Education Colorado [WEC]. (2005). Citizen’s Guide to Where Your Water Comes From. Colorado State Publications Library Digital Repository.