Water Supply

Colorado is a headwaters state supplying water to over five million Coloradans, 18 other states and Mexico, and does so through reliance on precipitation, mainly in the form of snow (Grace, 2015). Colorado’s Department of Local Affairs [DOLA], 2015) projects the state’s population to nearly double to 8.6 to 10 million people by 2050. As Colorado’s Water Plan (State of Colorado, 2015) points out, this population growth will create a significant need for an additional 600,000 to one million AF of water annually to meet future municipal and industrial (including self-supplied industrial) demands. Some areas of the state (e.g. South Denver Metro area) already need to replace nontributary groundwater supplies; therefore, simply acquiring new supplies within the state to meet future needs is not an option.

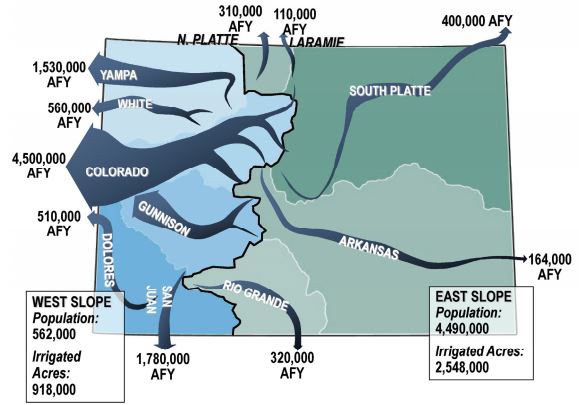
To further complicate growing water supply needs, supplies are not necessarily where demands are: approximately 80% of Colorado’s water falls and flows west of the Continental Divide, while 80% of the population and the majority of irrigated acres are found east of the Divide (Water Education Colorado [WEco], 2014; Colorado Water Conservation Board [CWCB], n.d., 2011). Although the West Slope is projected to grow at a faster rate than the Front Range, the Front Range basins (Arkansas and South Platte) will continue to have the largest populations in the state (CWCB, 2011).

Map depicting the difference between population, irrigated acres and where water flows out of the state of Colorado on the eastern and western slopes.

Colorado population, irrigated acres & flows. CWCB (2011). Population figures from 2010 U.S. Census & irrigated acreage from 2005. CWCB (2011).

An average of 13.7 million acre-feet of streamflow originates annually in Colorado via precipitation. However, due to delivery obligations from interstate compacts and agreements, less than 40%, or 5.3 million acre-feet (AF), is consumed within the state each year. Of this amount consumed, approximately 83% is supplied by surface water and the remaining 17% is supplied by groundwater (WEco, 2016; State of Colorado, 2015).

Colorado Consumptive Water Use

Total Streamflows: 13,700,000 AF          Total Consumptive Use: 5,300,000 AF

Charts recreated from Colorado Water Plan (2015). Note that figures represent consumptive use (water permanently removed from immediate water environment) by each sector, and therefore are lower than total water withdrawn or diverted.

Units of Measurement

Acre-Foot
Acre-foot (AF) is a measure of water volume equivalent to 43, 560 cubic feet or 325,851 gallons. One acre-foot of water covers approximately one acre of land (about the size of a football field, excluding the end zones) one foot deep.

 Approximately one acre-foot serves the needs of two families of four to five people for one year.


Key Concepts

Withdrawal vs. Consumptive Use
A water withdrawal refers to the quantity of water removed from a groundwater source or diverted from surface water to the point of use. Consumptive use, on the other hand, is the portion of a water withdrawal that is permanently removed from the immediate water environment by people, plants or processes (USGS, 2016). Consequently, consumptive use volumes tend to be smaller than total withdrawals.

Some states (e.g. North Dakota) track water use by consumptive use volumes, while others (e.g. Colorado) track usage by total withdrawals from a source (Golder Associates, 2014). It is important to decipher between the two, as water volume figures drastically differ.

Nevertheless, when water is withdrawn or diverted for a particular use, a portion is consumed by people, plants or processes (consumptive use portion), while the unconsumed portion makes its way back to rivers or shallow aquifers. The unconsumed portion is referred to as a return flow and allows for some of Colorado’s water to be used multiple times before leaving the state, as the return flows are able to be used again by downstream users (WEco, 2016; State of Colorado, 2015; U.S. Geological Survey [USGS], 2016). So although Colorado consumes an average of 5.3 million AF of water each year, the ability to use some of the water multiple times allows for total diversions of 15.3 million AF annually (State of Colorado, 2015). In addition to this 15.3 million AF flowing in surface streams, approximately 2 million AF of groundwater is withdrawn annually in Colorado (WEco, 2005).

Statewide Water Withdrawals

Chart recreated from Colorado Water Plan (2015).

Diagram depicting return flows from different water uses.
Return Flow Diagram. Altered from the Southern Nevada Water Authority (n.d.).

Water Use

Water uses in Colorado are generally broken down into two main categories: consumptive and non-consumptive. Uses which, for the most part, permanently remove water from their source so that it is no longer available for reuse are referred to as consumptive. Conversely, uses which leave flows in rivers are referred to as non-consumptive uses (CWCB, 2011; State of Colorado, 2015). It is important to note that consumptive uses do not always permanently remove 100% of withdrawals from the immediate water environment. As discussed above, return flows allow for the state to use some of its water numerous times before leaving the state. For example, while a significant portion of a withdrawal for crop irrigation is consumed via evapotranspiration, crops are not able to consume the entire portion of water applied. As a result, some form of return flow is provided, either as surface flow or groundwater recharge, which is then used by other downstream users (CFWE, 2016).

Below are the major water use categories in Colorado:

Consumptive

Water for agriculture is used for livestock and to irrigate crops, allowing for the agricultural industry to generate approximately $5 billion in revenues annually (WEco, 2005). Due to Colorado’s semi-arid climate, a significant quantity of water is necessary to sustain agricultural activities: of the total amount of water withdrawn or diverted statewide, approximately 86% goes to agricultural uses, with approximately 81% diverted from surface streams and 19% withdrawn from groundwater sources (WEco, 2016).

In terms of consumptive use, agricultural water use accounts for 89% of the statewide total, or approximately 4.7 million AF (WEco, 2016; State of Colorado, 2015). While this is a significant amount of water consumptively used, the CWCB (2011) reports that crops grown within the state (as of 2010) could stand to use an additional 2 million AF in order to be fully irrigated.

As the state’s water supply gap continues to widen, the number of irrigated acres are expected to decline 15-20% by 2050 due to urbanization and water transfers; however, agriculture is expected to continue to use the majority of Colorado’s water (State of Colorado, 2015).

To learn more about agricultural water use in Colorado, see Section 4.3 of the 2010 Statewide Water Supply Initiative and Chapter 5 of Colorado’s Water Plan (2015).

Municipal water, often referred to as M&I water, is used by Coloradoans in their homes, yards, businesses, firefighting and industry. Annual M&I deliveries for the state total about 975,000 AF, accounting for approximately 6.7% of total deliveries for the state (CWCB, 2011; State of Colorado, 2015)). Statewide, nearly 94% of the 975,000 AF is diverted from surface waters and only 6% withdrawn from groundwater aquifers (WEco, 2016); however, 19 of Colorado’s 63 counties rely solely on groundwater for potable and domestic uses (Colorado Geological Survey [CGS], n.d.). Groundwater withdrawals by public water supply systems and private wells serve an estimated 20% of the state’s population (CGS, n.d.).

M&I use can further be broken down into three categories: indoor use, outdoor use and water loss in distribution systems. Historically, outdoor use (primarily landscape irrigation) has accounted for more than half of annual domestic water use in the state, but from 2006-2016 this trend has changed toward a division of 60% indoor use and 40% outdoor use (WEco, 2016). The chart below depicts how M&I water deliveries are used in Colorado.

In terms of consumptive use, M&I water use consumes about 7% of the state’s total deliveries (WEco, 2016) and about 41% of total M&I deliveries; however, modeling from the 2010 Statewide Water Supply Initiative estimates that M&I has the potential to save 160,000-461,000 AF by 2050 through “active” conservation (CWCB, 2011). Additionally, another 43,000-61,000 AF of water could potentially be saved with more reuse of existing water supplies (WEco, 2016; CWCB, 2011). Based on population projections and under passive conservation, the CWCB (2011) estimates M&I water demands to increase from 975,000 AF to 1.36 million AF by 2035, and to 1.5 – 1.8 million AF by 2050.

To learn more about municipal water use in Colorado, see Section 4.2 of the 2010 Statewide Water Supply Initiative and Chapter 5 of Colorado’s Water Plan (2015).

“Industrial water use” is also commonly referred to as self-supplied industrial (SSI) use, because large industrial water users often have their own water supplies (separate from public water systems) or lease raw water from others (CWCB, 2011). Generally, water for industries is used for energy development, snowmaking, thermoelectric power generation, food processing and large industries, such as breweries. Together these industries require an average of 168,300 AF annually, which is about 1.1% of Colorado’s total annual deliveries (WEco, 2016; CWCB, 2011). Of this, approximately 80% is diverted from surface waters and 20% is withdrawn from groundwater aquifers (WEco, 2016).

Of the average 5.3 million AF consumed statewide annually, SSI consumes about 4%, or about 212,000 AF (State of Colorado, 2015). Due to the wide variety of water users within the SSI category, sub-sectors range from very high to very low water consumption (Kohli, Frenken & Spottorno, 2010).

Based on projections, the State estimates current industrial consumptive use to increase to between 236,000 and 322,000 AF by 2050, requiring an additional 48,000-134,000 AF annually to meet future demands (CWCB, 2011; State of Colorado, 2015). Within the past few years, a number of innovations have come to light for industrial users that have the potential to conserve not only water, but also energy. In order to assist in closing the looming supply gap, instituting these new innovations will require overcoming a number of hurdles, including increasing the understanding of options available, cost assistance in implementing the new technologies and overcoming indifference in water pricing, among others (CWCB, 2016).

To learn more about industrial water use in Colorado, see Section 4.2 of the 2010 Statewide Water Supply Initiative and Chapter 5 of Colorado’s Water Plan (2015).

Non-Consumptive

Recreational and environmental water needs often overlap: increasing the flow of a stream not only benefits fish and other aquatic life, but is also beneficial to anglers. Conversely, sometimes conflict can arise between the two if, for example, ideal river flows for rafting drastically differ from prime flows to support fish habitat. The deep interconnectivity of recreational and environmental water uses mean they are usually assessed and often managed together.

By identifying important recreational and environmental attributes (e.g. imperiled fish species, important boating and fishing areas) of streams and those which need protection or restoration, 13,500 perennial stream-miles were identified as “focus areas” in the state’s 2010 Statewide Water Supply Initiative (SWSI). The map below illustrates these areas. Of totally statewide annual water deliveries, non-consumptive uses currently account for about 5.5%, or about 841,500 AF.

Colorado is known for its wide array of recreational opportunities: from boating and rafting, to fishing and waterfowl hunting, many are dependent upon water. Water for recreational use is left in streams for activities that are water-based, rely on water to support the activity or have water as an integral part of the experience (State of Colorado, 2015). Recreational uses of water in Colorado’s Water Plan include boating, fishing, camping, wildlife viewing and waterfowl hunting.

Similarly, Colorado is also known for its vast and varied natural environment. Healthy watersheds, rivers and wildlife all significantly contribute to Coloradoan’s quality of life and the state’s vibrant tourist economy. Healthy and resilient aquatic ecosystems are dependent upon good water quality, connectivity of streams and robust instream and riparian habitats (State of Colorado, 2015); however, supply demands by other needs often complicate the ability to achieve these factors.

Some recreational and environmental activities involve consumptive uses of water and are categorized as different uses, such as with the irrigation of sports fields and golf courses by water from municipal providers, and are therefore counted as municipal use. Similarly, skiing depends on snowmaking which requires water rights that are typically owned by resort operators; therefore, snowmaking is considered an industrial water use (State of Colorado, 2015).

To learn more about recreational and environmental water use in Colorado, see Section 2 of the 2010 Statewide Water Supply Initiative and Chapter 5 of Colorado’s Water Plan (2015).

Map showing the nonconsumptive needs assessment for each of Colorado's major river basins.
Statewide Nonconsumptive Needs Assessment Focus Map. CWCB (2011).

Statewide Water Use & Consumption

Water UseStatewide Annual Water Delivery (AF)+% of Statewide Annual Water DeliverySurface Water Portion DivertedGroundwater Portion WithdrawnStatewide Annual Consumptive Use (AF)*% of Statewide Annual Consumptive Use
Agricultural13,265,10086.7%81%19%4,717,00089%
Municipal & Industrial1,025,1006.7%94%6%371,0007%
Self-Supplied Industrial168,3001.1%80%20%212,0004%
Non-Consumptive
(Recreational & Environmental)
841,5005.5%----
Total15,300,000100%--5,300,000100%
Data Sources: CFWE (n.d.b & 2016), State of Colorado (2016) & CWCB 2011. See References section for calculations and specific citation details.
Notes: Total annual water deliveries are 2008 figures. Due to rounding, figures presented may not precisely add up to totals.
+ Statewide Annual Water Delivery figures by sector are derived from the total statewide annual delivery (15.3 million AF, provided by the Colorado Water Plan, 2015) divided by each sector’s Percentage of the Statewide Annual Delivery (provided by the Colorado Foundation for Water Education, 2016).
* Statewide Annual Consumptive Use figures by sector are derived from the total statewide annual consumptive use (5.3 million AF, provided by the Colorado Water Plan, 2015) divided by each sector’s Percentage of the Statewide Annual Consumptive Use (provided by the Colorado Foundation for Water Education, 2016).

Colorado’s Water Plan by the State of Colorado (2015)
The state’s roadmap that leads to a productive economy, vibrant and sustainable cities, productive agriculture, a strong environment and a robust recreation industry. The plan sets forth the measurable objectives, goals and actions by which Colorado will address its projected future water needs and measure its progress—all built on its shared values. Chapter 5 discusses Colorado’s water uses by sector and projected gaps between future supply and demand.

Statewide Water Supply Initiative (SWSI) 2010 by the Colorado Water Conservation Board (2011)
SWSI 2010 is intended to enhance the available information on Colorado’s water supply future and to be used for general statewide and regional water supply planning. It is a forum to develop a common understanding of existing and future water supplies and demands throughout Colorado and to identify possible means of meeting Colorado’s consumptive and non-consumptive water needs.

Colorado Department of Local Affairs [DOLA]. (2015). Population Forecasts – 5 year increments, 2000-2050. Population Totals for Colorado and Sub-State Regions.

Colorado Geological Survey [CGS]. (n.d.). Groundwater. Water.

Colorado Water Conservation Board [CWCB]. (n.d.). Water Supply Planning. Water Management.

—–. (2011). Colorado’s Water Supply Future, Statewide Water Supply Initiative, 2010. Water Management.

Grace, S. (2015). Water in Colorado. Colorado Encyclopedia.

Kohli, A., Frenken, K., & Spottorno, C. (2010). Disambiguation of water use statistics. FAO AQUASTAT Programme.

State of Colorado. (2015). Chapter 5: Water Demands. In Colorado’s Water Plan.

Southern Nevada Water Authority. (n.d.). Return Flow Credit Diagram. Glen Canyon Dam Adaptive Management Program Wiki.

U.S. Geological Survey [USGS]. (2016). Water Use Terminology. Water Use in the United States.

Water Education Colorado [WEco]. (2005). Citizen’s Guide to Where Your Water Comes From. Colorado State Publications Library Digital Repository.

—–. (2014). Citizen’s Guide to Colorado’s Transbasin Diversions. ISSUU.

—–. (2016). Citizen’s Guide to Colorado Water Conservation (2nd ed.). ISSUU.


Table 1 References: Statewide Water Use & Consumption

Water Use Statewide  Annual
Water Delivery (AF)+
% of Statewide Annual
Water Delivery
Surface Water
Portion Diverted
Groundwater Portion Withdrawn Statewide Annual
Consumptive Use (AF)*
% of Statewide Annual Consumptive Use
Agricultural 15.3M * 86.7% =
13,265,100
86.7%
WEco, 2016 (p.3)
81%
WEco, 2016 (p.22)
19%
WEco, 2016 (p.22)
4,700,000
[5.3M * 89% = 4,717,000]
CWP (P.5-3)
89%
WEco, 2016 (p.3) &
CWP (P.5-3)
Municipal & Industrial 15.3M * 6.7% =
1,025,100
6.7%
WEco, 2016 (p.3)
94%
WEco, 2016 (p.22)
6%
WEco, 2016 (p.22)
400,000
[5.3M * 7% = 371,000]
CWP (P.5-3)
7%
WEco, 2016 (p.3) &
CWP (P.5-3)
Self-Supplied Industrial 15.3M * 1.1% =
168,300
1.1%
WEco, 2016 (p.3)
80%
WEco, 2016 (p.22)
20%
WEco, 2016 (p.22)
200,000
[5.3m * 4% = 212,000]
CWP (P.5-3)
4%
WEco, 2016 (p.3) &
CWP (P.5-3)
Non-Consumptive
(Recreational & Environmental)
15.3M * 5.5% =
841,500
5.5%
WEco, 2016 (p.3)
Total 15,300,000
CWP (P.5-3)
100% 5,300,000
CWP (P.5-3)
100%
Notes: Total annual water deliveries are 2008 figures. Due to rounding, figures presented may not precisely add up to totals.
+ Statewide Annual Water Delivery figures by sector are derived from the total statewide annual delivery (15.3 million AF, provided by the Colorado Water Plan, 2015) divided by each sector’s Percentage of the Statewide Annual Delivery (provided by the Colorado Foundation for Water Education, 2016).
* Statewide Annual Consumptive Use figures by sector are derived from the total statewide annual consumptive use (5.3 million AF, provided by the Colorado Water Plan, 2015) divided by each sector’s Percentage of the Statewide Annual Consumptive Use (provided by the Colorado Foundation for Water Education, 2016).